Every year, fifty million birds place a bet against weather, habitat, and decisions made on the other side of the world.
We know all we need to protect them. We just need to Act.
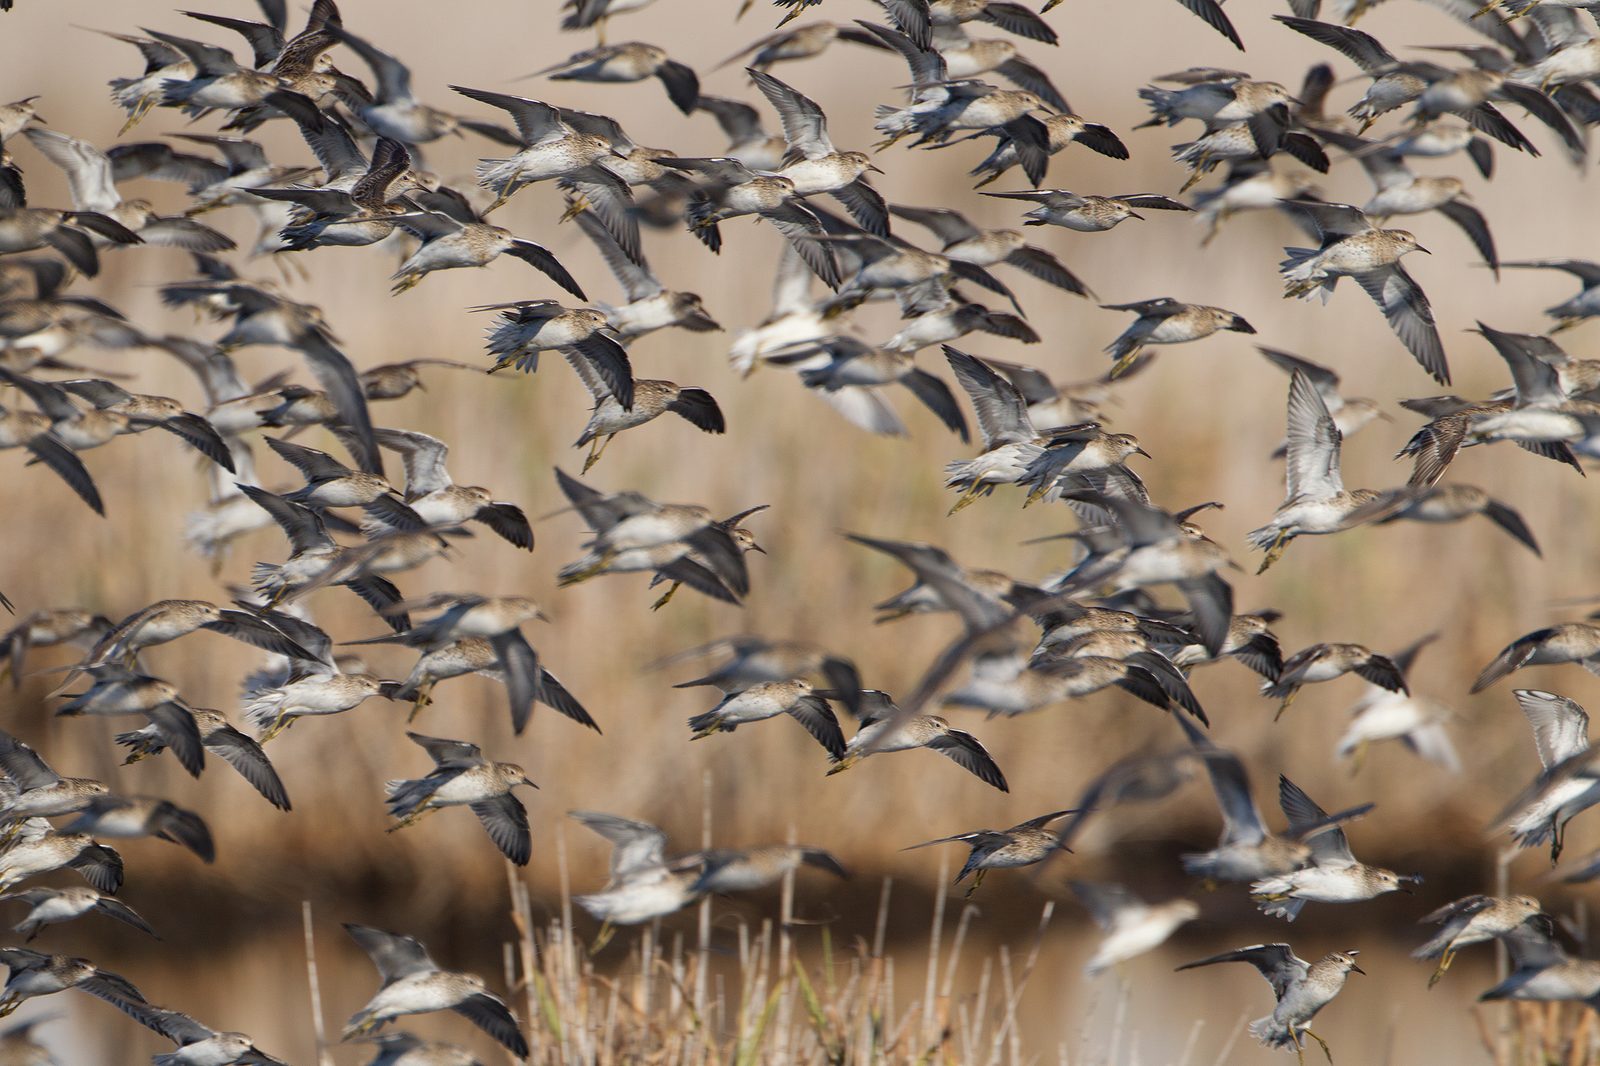
The simulator below focuses on a single species — the Bar-tailed Godwit, baueri subspecies, 126,000 individuals — because it is the most comprehensively tracked shorebird on the flyway and its annual circuit makes the pressures visible. What it faces, every migratory shorebird faces.
A godwit's year is a sequence of bets, each one staked on the result of the last. What happens in the Yellow Sea in April determines whether a bird arrives in Alaska in good enough condition to breed. What happens in Alaska in June determines how many fledglings join the southbound flight. What happens at Moreton Bay in October determines whether each bird arrives with enough reserves to survive the long wait before the northbound departure in late March.
Miss the fuel target at any stage and the cascade begins. A bird that leaves the Yellow Sea underweight arrives in Alaska too late and too depleted to breed successfully. A bird that breeds successfully but faces poor conditions at Moreton Bay may not accumulate the four grams of fat per day it needs to make the northbound crossing.
Each chip on the table below represents 1,000 birds. The history is fixed — drag the timeline to watch what happened. Cross 2026 and the future is yours to decide.
1950 to 2026 is what happened. From 2026 forward is what we can still choose.
Moreton Bay disturbanceHistorical data (1950–2026) is derived from published AWSG count records, Studds et al. (2017), and Yellow Sea habitat loss estimates. Population figures prior to systematic counts (~1974) are modelled backward from known data. The 1950 baseline of ~200,000 represents the estimated pre-degradation maximum for baueri. Future projections use a four-stage Leslie matrix. The model is simplified for educational use, it illustrates sensitivity to pressure changes, not precise prediction. 1 chip = 1,000 birds. At N₀ = 126,000 there are 126 chips on the table. At the 1950 baseline, there were 200.
Key references
The flyway is a system. Pressure at one point propagates through all the others.— What the simulator demonstrates
The simulator tells you the system can recover, or fail, depending on the decisions made along its length. The next question is which decisions, taken where. The Bay Roost Network map identifies the specific high-tide roosts in Moreton Bay where disturbance is currently determining outcomes for the birds shown above.
See the Bay Roost Network →The Shorebird Steward Program equips you to reduce the disturbance cost — at Moreton Bay, on the ground, with the birds in front of you.